
Purpose:
a. To map the presence and distribution of oil and gas seepage
to identify areas with a high potential for petroleum reservoirs.
b. Reduce the area to be searched by helping to focus exploration efforts
on regions and structures with active seepage.
c. Predict the oil versus gas potential of prospective structures.
Applications:
a. Regional Exploration Programs to define portions of basin of
concession areas with the highest potential for production. Regional studies
are often run in conjunction with regional seismic programs and may include
grids or other evenly spaced tests.
b. Trend Evaluation Studies can be used to evaluate the potential of regional
features and plays. Sample spacing is designed to sample a prospective
play without concentrating on individual structures or prospects.
c. Prospect Evaluation studies can be used to rate the relative seepage
magnitudes and compositions of individual prospects prior to drilling
so that structures with the highest potential are given a higher priority.
Close spaced sample grids in conjunction with high resolution geophysical
studies are most effective for multiple prospects.
d. Anomaly Detailing including very closely spaced samples and stratigraphic/geochemical
drilling programs can be used to detail oil source and maturity of individual
high magnitude seeps over specific prospects of interest.
Program Planning
a. Regional Exploration Programs
Regional exploration programs are designed to cover a large study
area with evenly spaced core samples to provide a rapid and cost effective
method of evaluating the potential of rank, unexplored areas. Typical
studies of this type include samples on 2 to 5 km centers. Regional studies
are of particular importance in large concession blocks with insufficient
subsurface data to provide meaningful guidance on prospect areas or trends.
The Green Canyon deepwater oil seeps in the Gulf of Mexico were first
discovered by this method.
b. Trend Evaluation Studies
Surface geochemical exploration programs can be used to define
the seepage levels and compositions of prospective structural trends.
Trend studies generally include collecting cores on local grids of 2 -
4 km centers as guided by seismic data and regional structural interpretations.
Surveys of this type can often confirm the existence of seeps along trend
away from known reservoirs and predict the oil versus gas potential in
these unexplored areas.
c. Prospect Evaluation
Prospect evaluation studies generally include integrated high resolution
geophysical evaluation of individual structures of interest and subsequent
core sampling to determine seepage levels and compositions. Results should
be compared with calibration studies over known fields where seepage levels
and reservoir compositions can be compared. Surveys generally include
a tight grid of geophysical lines over a structure and close spaced core
sampling at 1 to 2 km spacing over faults, gas charged zones and potential
migration pathways from the subsurface.
d. Anomaly Detailing
Once a significant anomaly or macro-seep is encountered, close
spaced geophysical surveying and coring can be completed to provide precise
details on the seepage distribution, composition and the relationship
of such seepage to specific subsurface faults. Detail evaluations are
often used in deep water and frontier areas where the acquisition of free
oil and gas macro-seep samples can provide significant information on
the source rock type and maturity which is not available due to limited
exploration wells in the area. Sampling patterns include very tight geophysical
grids and pinpoint core collection with spacing often less than 1 km.
Clustered core sites are often used. Additional subsurface data can be
obtained from stratigraphic and geochemical borings into seep areas.
Field Data Acquisition Tools
A wide range of sampling tools have been developed over the years
to obtain marine geochemical and geotechnical engineering data. All tools
as discussed in the following paragraphs have specific uses and applications,
depending on program needs, water depths and available budgets.
a. Sniffer
Sniffer systems pump a continuous stream of sea water from a height
of approximately 10 m above the seabed. One or more gas chromatographs
are used to continuously analyze stripped gases for methane through butane
light hydrocarbons.
- High density sample spacing along lines.
- Compatible with seismic surveys and may be run with ongoing seismic
programs or over existing seismic grids.
- Fast, up to 200 km data acquisition possible per day
- Results available in a relatively short period of time after completion
of field work. Not necessary to wait for laboratory sample analysis.
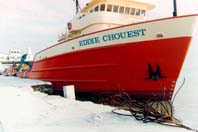
b. Piston/Gravity Coring
Gravity and piston coring tools generally include deployment of
a weighted steel pipe which is dropped into the seabed from a height of
10 to 20 m. Corer penetration is dependent on seabed soil conditions.
Sample lengths of up 20 - 30' are possible in soft bottom areas with corer
weights from 400 to 1000 kg.
- Can be deployed in very deep waters.
- Relatively large volume of core is available for hydrocarbon extraction
and analysis as well as geologic and engineering studies.
- Multiple samples can be run from each core.
- Large numbers of cores can be acquired per day
- Results can be easily integrated with high resolution geophysical studies
and deep seismic data.
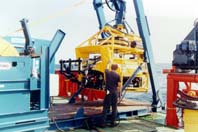
c. Vibro-Corer
Vibro Corers are often used in conjunction with piston/gravity
coring tools to increase penetration and sample recovery in areas of hard
bottom and sand.
- Improved recovery in sand and hard bottom areas.
- Can be deployed from gravity/piston coring deployment systems and quickly
interchanged as needed during field program
d. Integrated Geophysical Study in Conjunction
With Gravity/Piston Coring Program
High resolution geophysical tools can be used in conjunction with coring
methods by identifying seepage zones and targeting coring activities to
faults, gas charged zones and other seabed features. Typical tools include
sparker or boomer sub-bottom profilers, side scan sonar, pingers and echo-sounders.
- Cores are collected on geologic features with a high potential for seepage.
- Near surface structural information is available for data interpretation
and tying seepage zones to deep seismic data
- Preliminary feature maps can be created in the field
- Geochemical studies can share mobilization with site survey studies
since vessels and equipment are generally the same.
e. Geochemical Drilling
Geochemical drilling programs include anchoring a geotechnical drilling
vessel over a known area and drilling or jetting to obtain samples up
to 200 m below the seabed.
- High quality geochemical data from downhole samples below the depth
of oxidation.
- Can be combined with geotechnical drilling programs to reduce mobilization
costs.
- Continuous downhole profiles increase confidence and reliability of
geochemical results.
- Deeper stratigraphic drilling programs can obtain source rock samples
for more detailed analyses.
Positioning and Geophysical Tools
a. Differential Global Positioning System (D-GPS)
D-GPS is typically used for accurate navigation and positioning
of survey lines and cores. With an accuracy of about +/- 3 m all features
are located precisely so that results can be integrated into clients existing
exploration data bases.
b. Sub-Bottom Profiler
Sub-bottom profilers such as sparkers or boomers are used to provide
high resolution geophysical profiles along existing seismic lines and
over structures of interest. Profiles can be interpreted onboard and used
to select core locations over areas with faults, gas charged sediments
and other preferential migration pathways from depth.
Mapped sub-surface features can be compiled on base maps for comparison
with seepage anomalies and deep structure as mapped by conventional seismic
interpretations.
c. Side Scan Sonar
Side scan sonar systems records a two dimensional, or map view,
of the seabed and of objects and bathymetric features. on the seafloor.
Side scan sonar data are used for identify seep related seabed features
such as mud volcanoes, pockmarks, authogenic carbonate mounds and gas
bubbles in the water column. Since the side scan sonar maps a wide swath
of the seafloor it is possible to map features which do not lie directly
on the survey line.
Features mapped from side scan sonar data can often be used to identify
macro-seep zones as well as the surface expression of outcrop, faults
and other structural features.
d. Echo Sounder
Echo sounders are employed during all geophysical studies and coring
programs to confirm water depth along geophysical lines. Accurate water
depth data is essential so that corers can be deployed and dropped the
correct height above the seabed. Bathymetric data is also of general use
for planning future exploration programs and can be used to map seabed
geologic features.
Core Sample Processing
Sediment cores are processed to provide up to three sets of samples
from varying depths in the core. By this method multiple analyses for
each sample are available for interpretation, significantly improving
the recognition of anomalies.
a. Headspace Gas Samples
Headspace gas samples are processed by adding a 200 cc of sediment
to 300 cc of degassed brine solution and sealing the mixture in a 500
cc can. A 100 cc laboratory grade nitrogen headspace is added by displacing
100 cc of brine. Samples are then heated in an oven at 70 degrees C for
12 hours and briskly shaken for 3 minutes to extract hydrocarbon gases
from the sediments into the headspace. Samples can then be displaced from
the can into an evacuated serum bottle to insure that gases are not altered
during the time from sample collection to analysis.
b. Sediment Samples
Sediment samples for extraction of petroleum liquids are double
bagged in the field and frozen onboard. Additional samples are recovered
as necessary to preserve materials of geologic interest or when macro
seepages of petroleum are encountered. Archive samples are also available
for client analysis and other geologic and engineering studies.
c. Core Logging
Each core is measured and described onboard to provide a record
of the volume and type of sediment recovered. Information recorded includes
time, date, water depth, location coordinates, sampler type, core recovery,
physical description, samples collected and depths from seabed and other
information which may be of geologic or engineering interest. In addition
all samples are inventoried on a computerized data base.
Laboratory Analytical Methods - Core Samples
A wide range of analyses can be performed on samples of each core
to fully characterize the full range of petroleum hydrocarbons expected
in nature from natural gases to heavy oils. Typically 2 to 3 samples from
each core are analyzed for both natural gas and oil indicators. Selected
samples showing strong indications of liquid petroleum are then extracted
and analyzed to further differentiate oil type, maturity and possible
sources. These results can then be compared with oil and gas samples from
known reservoirs.
Headspace Gas Analysis
a. Methane - Butane Light Hydrocarbons Analysis of Headspace Gases.
Light hydrocarbon analyses of headspace gas can be used to identify active
gas seepage from depth and as tool to help predict the oil versus gas
potential of the study area. Measured gases include methane, ethane, propane,
iso-butane and normal butane by Flame Ionization Detector (FID) gas chromatography.
b. C5+ Gasoline Range Hydrocarbons Analysis of Headspace Gases.
C5+ gasoline range hydrocarbon analyses by FID gas chromatography can
be used to quantify the gasoline range liquid hydrocarbon content of the
sediments. Resultant chromatograms are subdivided by molecular weight
ranges of Pentane - Benzene, Benzene - Toluene, Toluene - Xylene and Xylene+
hydrocarbons for comparison with signatures from oil samples from known
reservoirs.
c. Stable Carbon Isotope Measurements
Stable carbon isotope measurements of selected headspace gas methane samples
can be used to help differentiate biogenic versus petrogenic influences
on the measured gases.
Sediment Analysis
a. Synchronous Fluorescence Analysis of Sediment Extracts.
Synchronous fluorescence scanning of sediment extracts identifies the
aromatic hydrocarbon content of migrated petroleum liquids. Fluorescence
signatures can also be used to identify heavy versus light oil types for
comparison with known oils from the study area.
b. Total Petroleum Hydrocarbon Screening
Total petroleum hydrocarbon screening methods provide a rough estimate
of the total amount of oil in the sample. TPH screening can be used as
a very rapid onboard screening tool to identify samples for more detailed
extraction and analysis.
c. CS2 Extraction and C15+ Hydrocarbon Analysis
CS2 extraction and chromatographic analyses of sediment extracts provides
an excellent method of characterizing the gasoline to diesel range signature
of selected samples. This technique allows the comparison of extract signatures
with petroleum signatures from nearby reservoirs.
d. Capillary Gas Chromatography.
Capillary gas chromatography analyses are run on selected samples showing
significant liquid petroleum levels as defined by C5+ and fluorescence
tests. Results provide a more detailed differentiation of the C15+ component
of migrated oils for comparison with known oils.
e. Other Analyses.
Biomarkers and other whole oil and source rock tests can be run if the
sufficient quantities of oil rich sediments are recovered from core samples.
Interpretation of Results
Objectives
a. Seep Magnitudes
To map the horizontal distribution of seepage areas with respect to known
production, prospective trends or structures and low potential areas.
b. Seep Compositions
To make a reliable prediction of the oil versus gas potential of the areas
of interest and statistical support of such predictions.
c. Petroleum Characterization
Provide detailed characterization of the petroleum constituents and the
possible sources and contrast possible source type or maturity changes
between anomalous areas.
d. Integration with Geologic Model
Interactive integration of geochemical results with regional geologic
or prospect data to help improve understanding of the basin of interest
and to help identify additional prospective trends or structures.
Typical interpretive products include:
a. Numerical Data Tables
Numerical listings of all data sets including plotted fluorescence profiles
and CS2 extraction chromatograms.
b. Summary Statistics
Statistical tables including the maximum, minimum, mean and standard deviation
of each geochemical magnitude and compositional component.
c. Histograms of Magnitude and Compositional Components
Histograms are generated for each magnitude component to help differentiate
natural background levels from anomalous seepage zones. Compositional
histograms are used to help differentiate the oil versus gas potential
of the study area and define compositional populations which may suggest
variable sources in the study area.
d. Interpretive Dot Maps
Interpretive dot maps are used to allow both magnitude and compositional
data to be posted on a single product. Individual sites are color coded
to reflect seepage composition while the dot size reflects magnitude of
seeping gases. By this method the low magnitude and background sites are
posted as very small dots. Interpretive dot maps are of particular use
in areas with widely space data point where insufficient sample coverage
is available for contouring.
e. Summary Interpretation
Summary interpretive products are used to combine the various products
into a single map which clearly show the magnitude and compositional signature
of all data sets acquired during the survey. Products include projecting
compositional histograms, fluorograms and chromatographs onto a summary
anomaly map. Summary maps may also include regional geologic or structural
data.
f. Seismic Feature Maps
High resolution geophysical interpretations are compiled onto seabed features
and shallow structural interpretations to overlay geochemical survey maps.
Seabed features maps include seep mounds, mud volcanoes, pockmarks and
other information mapped from side scan sonar data. Structural interpretations
include a map of faults, fractures, channels, gas charged zones and other
subsurface features mapped from the high resolution geophysical data.
Marine Sniffer Database
- Gulf of Mexico
Deep
Water Marine Geochemical Coring. Data Example: Green Canyon, Gulf of Mexico
Integrated
Marine Geochemical Exploration Programs. Data Example: Northern Chukchi
Sea, Alaska
Offshore
Sniffer Survey: High Island Area, Gulf of Mexico
Geochemical
Discoveries Offshore Venezuela and Trinidad
Calibration
Survey, Central Bonaparte Basin, Australia